| Brief
introduction
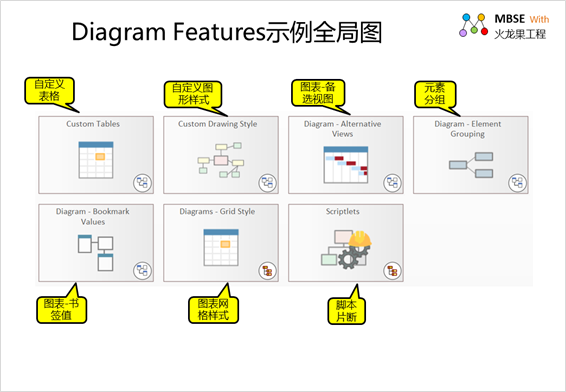
EA provides a variety of charting
capabilities while supporting visual modeling, including:
• Custom tables: can
be used to display a variety of non-modeled data.
• Custom Graphic Styles:
You can customize the styles of various graphics,
such as color, transparency, border style, etc.
• Chart Selectable
Views: Provides a range of views for the same information
from different perspectives:
•
list
•
Gantt charts
•
Relationship matrix
•
Specification view
•
Construct views
•
Kanban boards
The user can also make changes
to the elements on the diagram:
• Element Grouping:
You can group elements based on color, font, and more.
• Tag bookmarks: Bookmarks
can be set to elements of a diagram with numbers or
text to identify elements on a diagram, especially
for sorting elements with markers, bookmarks are useful.
In EA, you can also use scriptlet
elements to customize the appearance of elements in
a view through scripting. Scriptlet is a powerful
JavaScript-based tool. In this article, we provide
the following features using Scriptlets:
• Chart grid style:
Can be used to build a spreadsheet, a dashboard, or
a home page for your model.
• Script Snippets:
You can use script snippets to dynamically customize
other properties such as appearance, text, tagged
values, and more by leveraging EA's underlying Rich
Diagram and Element APIs.
Various charts supported in EA
The following is a detailed description
of the various charts supported by the EA.
1 °¢Customize the table
Custom tables can be used to display
a variety of non-modeled data.
Here's an example:
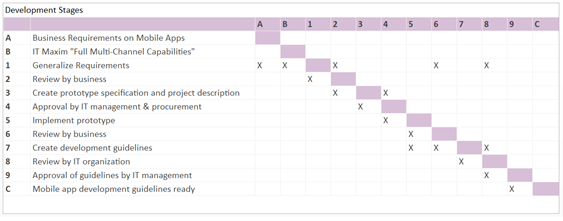
Example 1: Development phase
The following is an example of
an application of a custom table: describing the phases
of development.
How it works:
• To manually edit
table data, you must put the table in Edit mode. To
do this, select the table and press "F2"
or right-click and select "Edit Custom Table".
To exit editing mode, press "Esc" or right-click
and select "Exit Editing".
• Custom tables can
also define an action called "Script". The
script can be executed by right-clicking and selecting
"Execute Behavior Script". The script can
update the cell data in the table by using an API
function.
• To view and edit
the Script code, select Design > Element > Behavior
or Develop > Source Code > behavior on the ribbon.
A code editor window will open where you can enter
the required script code.
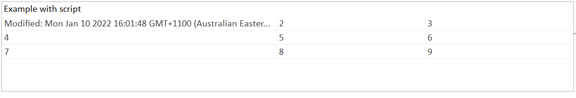
Example 2: Samples vs. Scripts
Here's an example of a custom
table: Use a script to generate the contents of a
custom table.
How it works:
• Right-click on this
tab and select the menu item "Execute be havior
script"
• The contents of the
cell (0,0) will be updated by the script
• The executed script
is saved as an action named "script".
It demonstrates four basic things
to do for updating table values:
• Get table elements
• Get the grid elements
of the table
• Set the values of
cells within the grid
• Save updated data
(grid data is saved in XML to tagged value data)
Note: When the script runs, the
data for the position (1,1) in the cell will be updated
to show the date and time of its data update.
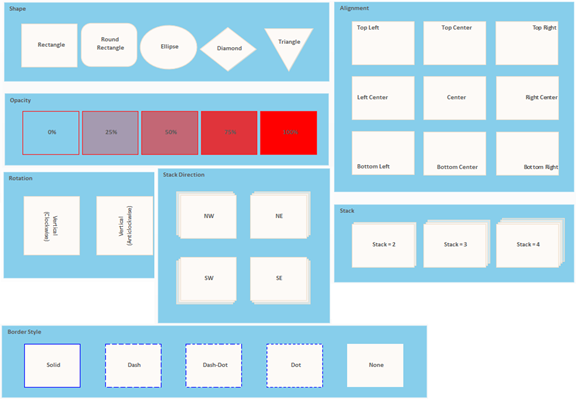
2 °¢Customize the style graphics
Custom style graphics, you can
customize the style of various graphics, such as color,
transparency, border style, etc.
Example 1: Custom-style graphics
Here's an example:
How it works:
Applying the Custom Style option
to the diagram (located in the Appearance section
of the diagram's properties window) or to an element
(found in the context of the element menu / Appearance
/ Enable Custom Drawing Style) will display a series
of formatting buttons that appear above the context
menu when you right-click on an element on the diagram.
These buttons can set these properties
on the selected element:
• color
• transparency
• Text alignment
• Text rotation
• Icon position (when
applied)
• Icon size (when applied)
• stack
• Stack orientation
• Border style
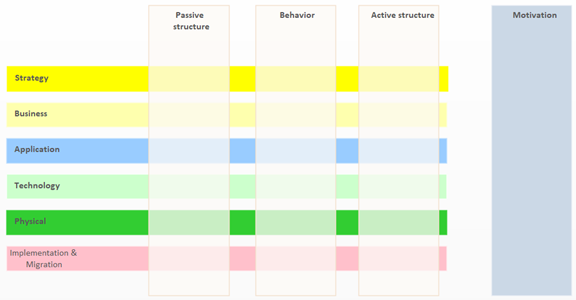
Example 2: Full framework
Here's an enterprise architecture
framework diagram built using custom-style graphics:
• Longitudinal: motivational,
active structure, behavioral, passive structure
• Horizontal: Strategy,
Business, Application, Technology, Physical, Implementation
& Migration
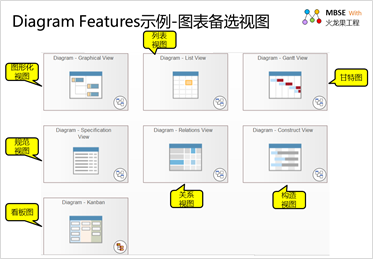
3°¢ Chart optional view
An optional view of a chart is
a series of graphs that provide the same information
from different perspectives.
Chart alternate views supported
by the EA are:
• Graphical view
• List view
• Gantt charts
• Specification view
• Relationship matrix
view
• Construct views
• Kanban diagrams
For Relationship View and Construct
View, you need to switch to the corresponding view
after the diagram is opened.
Kanban charts are a special type
of diagram that can only be displayed as Kanban.
Here's an example:
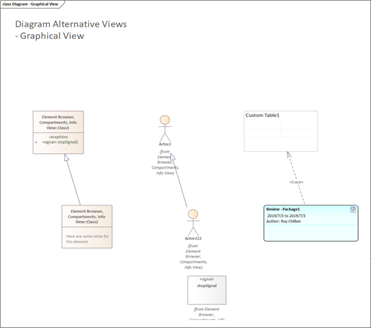
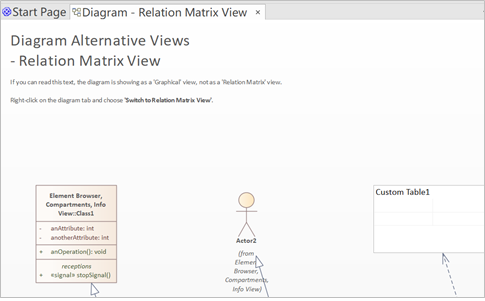
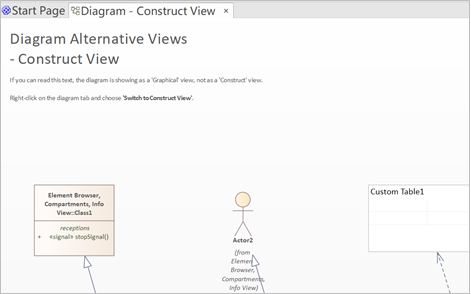
Example 1: Graphical view
The following is a graphical view,
which is often referred to as modeling, which is the
form:
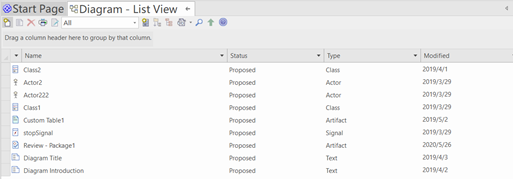
Example 2: List view
Here's a list view, which presents
elements as a list:
This is a much-needed form of
requirements management.
Example 3: Gantt view
Below is the Gantt view, which
can help you create a schedule and track your progress.
Example 4: Spec view
Here's a view of the specs that
looks like a document:
The spec view is great for requirements
management.
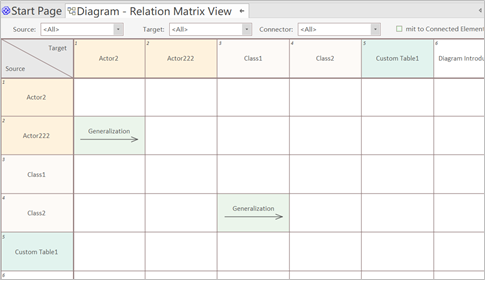
Example 5: Relationship matrix
view
On the model view, right-click
on the diagram tab and select "Switch to Relationship
Matrix View",
The current model diagram is displayed
as a relationship matrix, and the following is the
view of the relationship matrix after switching
The matrix view helps users manage
the tracking relationships between various elements.
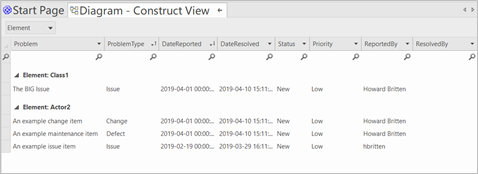
Example 6: Constructing a view
On the model view, right-click
the diagram tab and select Switch to Construction
View.
The current model diagram is displayed
as a construction view, as shown below the switched
construction view
elements are presented in the
form of a list and have various attributes required
for management, such as:
• Status: Status
• Priority: Priority
• ReportedBy : Reporter
• ResolvedBy: Executor
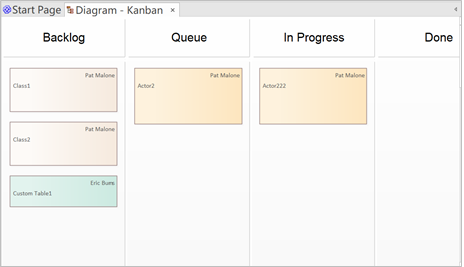
Example 7: Kanban diagram
Here's an example of a Kanban
view:
Users can drag elements in the
board to implement status changes and progress tracking.
4°¢Element grouping
When there are many elements in
the model, you need to group the elements. In the
EA, elements can be grouped according to color, font,
etc.
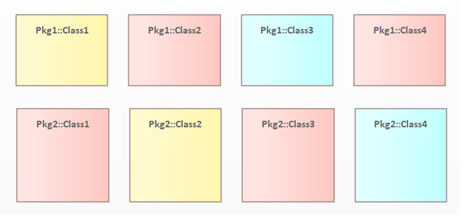
Example: Element grouping
• The elements on this
diagram are divided into three different groups, which
are set with different colors.
• Selecting any one
element in a group will select all elements in the
group, and you can then perform actions on the elements
as a collection, such as moving, setting colors, fonts,
and so on.
• Select and drag a
rectangle on a group of elements, and you can still
select single or multiple elements on the chart, regardless
of grouping.
How it works:
• To group elements,
select the elements you want to group together, right-click
on any of the selected elements, and select "Group
Elements" from the menu.
• To ungroup elements,
select a group, then right-click on the selected element
and select Ungroup Elements from the menu.
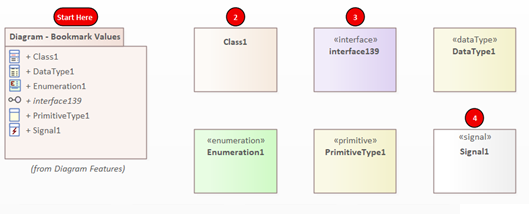
5 °¢Bookmark charts
Bookmarks can be set to chart
elements with numbers or text to identify elements
on the chart, especially when order is important.
Here's an example:
Example: Chart bookmark values
How it works:
• Right-click on an
element and select Set Bookmark Value from the pop-up
menu.
• To show or hide all
bookmarks on the diagram, right-click on the diagram
background and select "bookmarks > show (or
hide) all Bookmark Values" from the pop-up menu.°£
6 °¢Network style charts
• Grid-style charts
can build a spreadsheet, a dashboard, or even a home
page for your model.
• For example, some
spreadsheets, such as overlays, can automatically
limit elements to a specified set of rows and columns.
• Automatically split
the chart into cells, i.e.:
•
Each grid cell can hold one element
•
Row, column, and cell size can all be configured with
optional row and column headers to help through grid
position
•
Reference cells (e.g. A:1)
•
Provides a new scripting API that can reference elements
by their grid position
•
Integration with new Scriptlet elements to automatically
update and process elements in the grid
•
It is a new powerful tool for organizing and managing
large sets of information
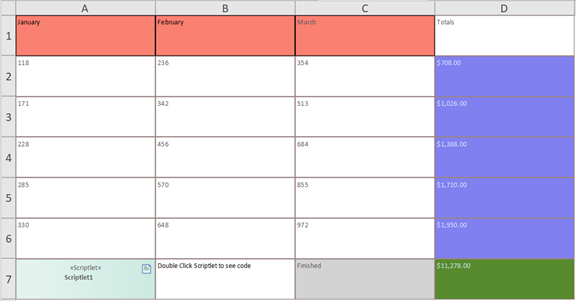
Example 1: Spreadsheet
Here's an example of a spreadsheet
where the contents of each cell are generated using
a scriptlet. Scriptlets allow you to update the value
of each element (cell) on the grid. Users can double-click
a cell to edit the corresponding Scriptlet script,
or they can use the context menu to run a Scriptlet
script to update the cell.
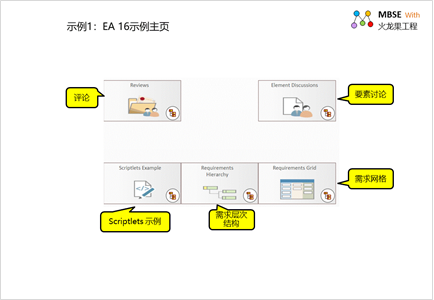
Example 2: Model Diagram Home
Page Directory
The catalog view of the model
diagram can generate navigation cells by linking multiple
model diagrams, and then list them in a directory
view, and when the user clicks on a navigation cell,
the corresponding diagram will be opened. Here are
the navigation cells provided by the EA 16 sample
home page: Comments, Element Comments, Scriptlet Examples,
Requirements Hierarchy, Requirements Grid
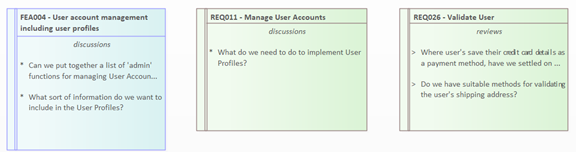
Here's an example of an element
comment:
Users can open the comment interface
to record and view the comments.
How it works:
By selecting Start > collaboration
> (Journal | discussion |.) Review) to access the
discussion and comment window from the ribbon.
It provides three separate pages:
Logs, Discussions, and Comments.
• The Log page is a
daily log that records thoughts, activities, or developments
related to that element.
• The Discussions page
is used to record formal discussions about elements
between team members.
• The Review page shows
a formal review of the element. It only shows review
topics that are linked to specific elements.
The following diagram shows that
separated visibility is enabled for viewing and discussion
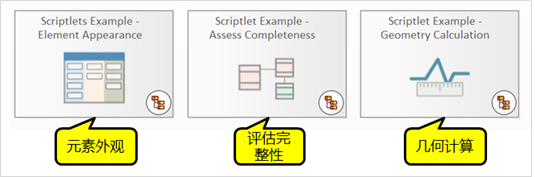
7°¢Script fragments
Users can use script snippets
to take advantage of EA's underlying Rich Diagram
and Element APIs to dynamically customize appearance,
text, tagged values, and other properties.
The EA provides a number of model
examples, and here are three example diagrams that
show several ways to enhance your model using the
power of scriptlets.
Here's an example of this:
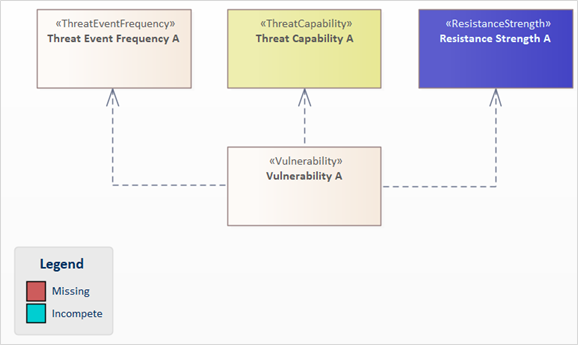
Example: Assessment Integrity
- Threat Community Pattern
This risk classification map from
the Model Wizard adds a Javascript Scriptlet element
to assess the author's completeness of each thread
element. If the required details are incomplete or
missing, the elements are colored accordingly.
How it works:
To see the JavaScript code executed
by a scriptlet, select the Scriptlet artifact in the
diagram, and from the Develop ribbon, select the Source
code > Behavior > Edit Internal code option.
postscript
I hope you have benefited from
reading this article.
If you are interested in sharing
your experience, please feel free to contribute to
us, and if you are interested in our training, consulting
and tools, please learn about:
• Modeling Tools£∫ EA
• MBSE platform£∫ iSpace
• Model web browsing
too£∫ WebEA
• Course£∫ System Design and Modeling Based on SysML and EA
• Course£∫ System analysis and design based on UML and EA
• Consulting Solution£∫
MBSE (Model-Based Systems Engineering).
• Consulting Solution£∫
Model-driven development based on UML
• All modeling-related
courses£∫ http://www.modeler.org.cn/course/index.asp
• Consulting Solution£∫
Model-Based Project Management
If you would like to learn more:
Welcome to the Modelers Channel
http://tool.uml.com.cn/ToolsEA/introduce.asp
You are also welcome to contact
us directly at umlooo@hotmail.com
|