| Introduction
to Sequence Diagrams
A sequence diagram is a form of
interaction diagram that shows the development of
objects along a lifeline, and the interactions between
objects over time are represented as messages from
a source lifeline to a target lifeline.
Sequence diagrams can be used
to:
Describe workflows, messaging, and how elements
work together over time.
Capture the flow of information and responsibilities
across the system early in the analysis; Messages
between elements end up being method calls in the
Class model.
Build explanatory models for use case scenarios;
By creating a sequence diagram that includes the
actors and elements involved in the use case, you
can model the sequence of steps for users and systems
to accomplish the required tasks
Composition of a sequence diagram
Sequence elements are arranged in horizontal order,
and messages are passed back and forth between the
elements
Messages on a sequence diagram can be of many
types; Messages can also be configured to reflect
the actions and properties of the source and target
elements
The Actor element can be used to represent the
user who started the event stream
Patterned elements, such as boundaries, controls,
and entities, can be used to illustrate screens,
controllers, and database items, respectively
Each element has a dashed stem called a lifeline
that exists in it and may participate in the interaction
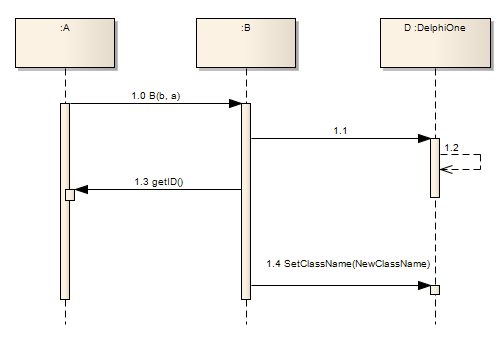
Example of a sequence diagram
The following is an example of
a sequential diagram that identifies the types of
elements and relationships.
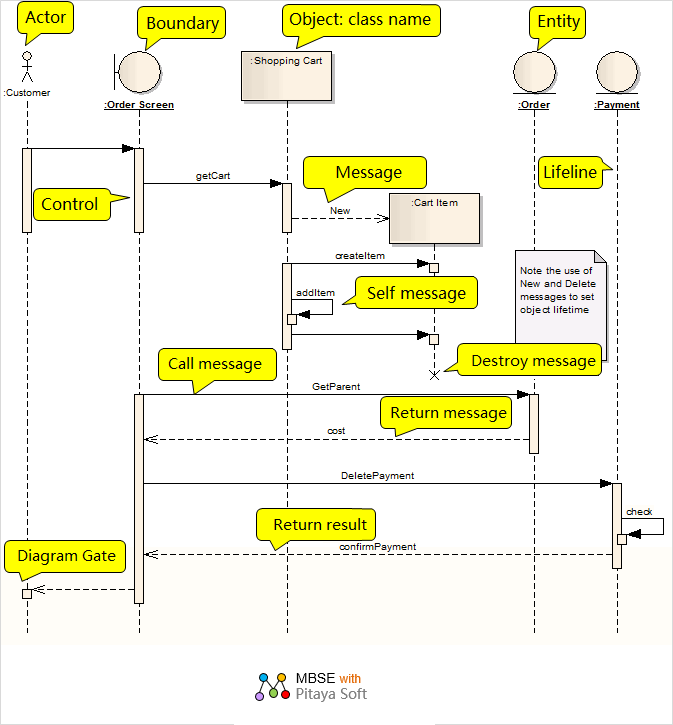
Elements of a sequence diagram
| Icon
|
Element
|
Description
|
 |
Role
|
Actors are users of
the system; A user can refer to a human user in
the model, a machine, or even another system or
subsystem.
|
 |
Lifeline
|
A lifeline represents
a unique connectable element that is an individual
participant in an interaction.
|
 |
Boundary classes
|
Boundary is a stereotype
of a class that models some system boundary, usually
a user interface. Boundaries are used in analytics
to describe the interaction between users and
systems.
|
 |
Control class
|
Control is a stereotype
of a class that models a control entity or manager.
Control classes are used to control and dispatch
other classes, and are typically used in analysis
(including robustness), sequences, and communication
graphs.
|
 |
Entity classes
|
Entity is a stereotype
of a class that models information or stored data
in a system.
|
 |
Combine clips
|
Fragment elements can
represent iterative or conditionally executed
interactive processes in a sequence diagram.
|
 |
Endpoint
|
Endpoints are used
in interaction graphs to reflect lost or found
messages in order.
|
 |
The gateway of the
figure
|
A Diagram Gate is a
simple graphical way to indicate the point at
which a message can pass in and out of an interactive
fragment.
|
 |
Status / Continuation
|
State Constant/Continuation,
the element provides two distinct purposes for
the sequence diagram, the state invariant and
the continuation part.
|
 |
In turn
|
You can use interaction
elements to insert an interaction diagram as a
child of a class element.
|
Legend: Fragment legend
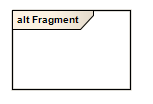
A fragment is a combination of
an interactive fragment in a sequence diagram. A complex
sequence diagram can be divided into several parts,
each part is called an interaction fragment, each
interaction segment is surrounded by a large box,
and its name is displayed in the interval in the upper
left corner of the box, representing the information
of the sequence diagram.
A composite fragment can contain
several fragments, each with a Boolean constraint.
Combine Fragments appears as a transparent window,
where each fragment is separated by a horizontal line
and can have its own trigger.
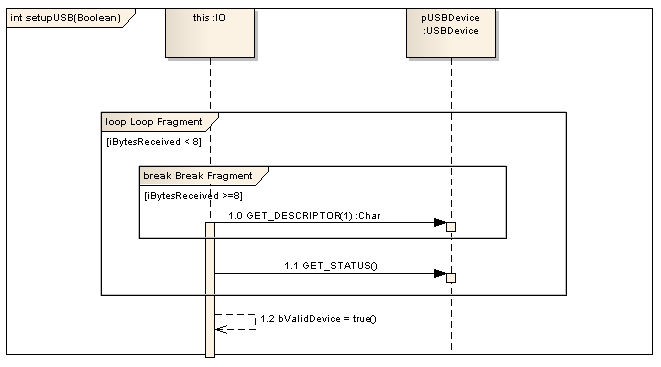
Here's an example of a combined
fragment:
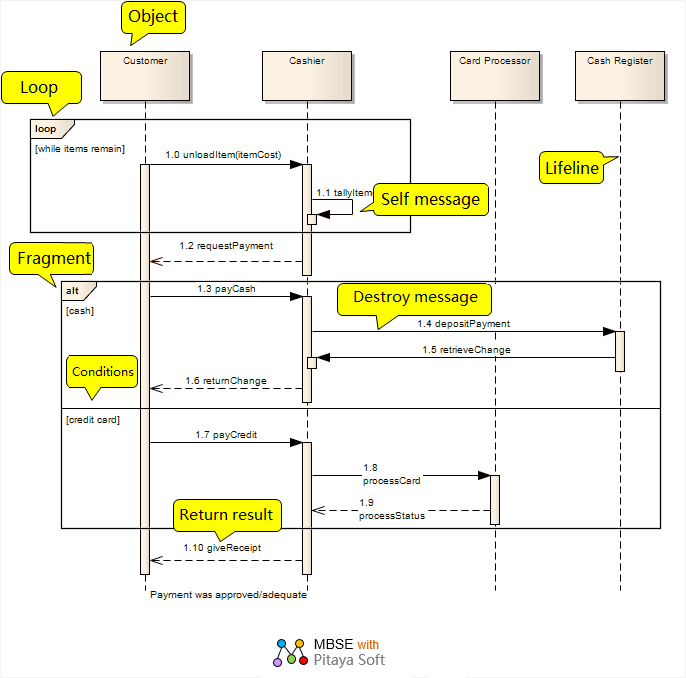
This sequence diagram illustrates
how to model a streamlined procurement process using
combined fragments.
There are 2 fragments in the sequence
diagram above
• One of them is a loop
fragment that indicates that the cashier counts each
purchased item until the price of all items is completed,
and then the cashier asks the customer to pay.
• The other is a conditional
judgment combination fragment, which represents a
judgment on a payment method that is then split to
show the processing fragment of the two conditions,
cash and credit card. After the payment fragment execution
is complete, the cashier provides the receipt to the
customer.
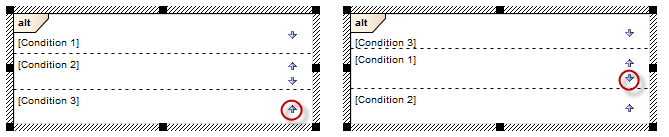
The order of the interaction fragment
conditions can be changed directly on the diagram:
- Select an interaction fragment that defines multiple
criteria; Up and down arrows appear to the right
of each condition.
- Click the corresponding arrow to change the order.
How-to guide: Select and move
combo clips
In order to select a grouped region,
you must click near the inner edge or drag a selection
rectangle around the region.
Once included in a fragment or
fragment condition, the message will continue to be
included as it moves up and down in the chart. To
move a message out of a fragment, or to a different
location in a sequence within a fragment, hold down
the Alt key while dragging the message into place.
As the message in it moves up or down, the fragment
on the sequence diagram will resize to continue to
contain the message.
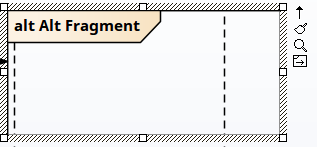
To move a composite fragment independently
of its contents, make sure the "move freely"
element icon is visible;
If it doesn't appear, click the "Move contents"
icon is visible;
If it doesn't appear, click the "Move contents"
icon and drag the
element border. and drag the
element border.
Interaction Clips within a Combine
Clip condition cannot be moved outside of the condition
unless the clip is in "move freely" mode.
Moving a conditional row moves any objects and messages
below the conditional row down or up based on how
much it moves.
When a contained clip is resized,
a clip containing other clips is resized (unless the
clip is in "move freely" mode).
How-to guide: Fill opacity
While interaction fragments often
contain many other elements, there may be reasons
why these elements are hidden and when they are fully
displayed, or it may simply indicate that they are
there, depending on the immediate purpose of the diagram.
You can apply these nuances to the display of elements
behind interactive fragments and overlaid or overlapping
elements by changing the opacity of the elements.
Before setting the opacity, check
if the element has a fill color.
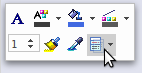
Opacity can be set using the icons
in the toolbar of the following two pop-up elements:
- Click on the interaction fragment element and
 icon: icon:
- Right-click on the Interaction Fragment element
and look above the context menu£∫
Click the icon
and select: icon
and select:
The total opacity is 100%, where the elements
behind the interaction fragment and overlapping
or overlaid are hidden (you can right-click on a
single element and select "Z-Order |.")
Bring to Top" option to display only these
elements)
0% indicates no opacity, where no fill color is
applied and anything behind the interaction clip
is fully visible
75%, 50%, or 25% sets the appropriate opacity
and makes the overridden element visible but overshadowed
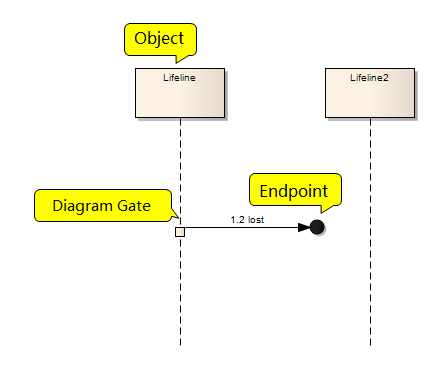
Legend: Endpoints

The message endpoint element defines
the termination of a state or numeric lifeline in
the time graph. It indicates the message:
• An undefined point
that originates outside the lifeline, which can be
referred to as message finding.
• Sent to an undefined
point outside the object's lifeline, which can be
referred to as a message loss.
Endpoints are used in interaction
graphs (sequences, timing, communication, or interaction
overviews) to reflect lost or found messages in order.
Using the sequence diagram, drag
the message from the appropriate lifeline to the endpoint.
For sequence diagrams, messages that connect lifelines
to endpoints require some sequential specification
to draw the connection. The following example depicts
missing messages in a sequence diagram.
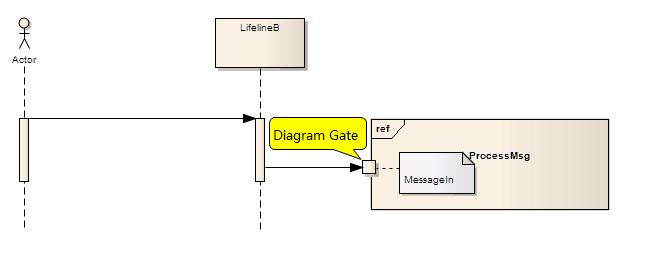
Legend: Diagram gate

A diagram gate is a simple graphical
way to indicate where a message can be transferred
to or outside of an interaction fragment. A fragment
may be required to receive or deliver a message; Internally,
ordered messages reflect this need, indicating the
entrance at the boundary of the fragment frame. Any
external messages that are synchronized with this
internal message must correspond appropriately. Portals
can appear in interaction diagrams (sequence, time,
communication, or interaction overview), interaction
events, and combined fragments (to specify expressions).
Legend: Status / Persistence
State/Persistence - Elements serve
two different purposes for an interactive (sequence)
diagram, namely state invariant and persistent. When
you create an element, you'll be prompted to determine
its purpose.
Legend: Interactions
You can use interaction elements
to insert an interaction diagram as a child of a class
element. Interactive elements can contain any of the
following types of diagrams:
sequence
correspondence
Time
Interactive elements in an EA
are considered the behavior of the classifier encapsulated
in it. It can have parameters and return types that
are modeled using the Behavior tab of the Properties
dialog of the interactive element.
Relationships of sequence diagrams
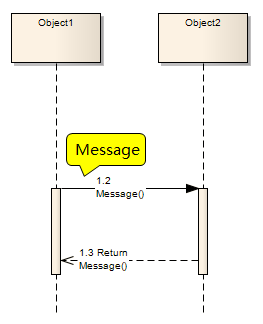
Message
Sequence diagrams use messages
passed from element to element to describe a workflow
or activity that changes over time.
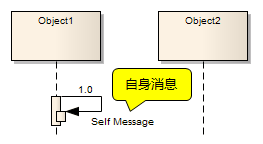
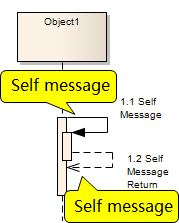
Self message
Self-Message reflects a new process
or method that is invoked in an action that invokes
a lifeline. It is the specification of the message,
usually in a sequence diagram.
Self-Message Calls represent nested
calls; A new activation level is added with each call.
Self message returns
You can describe the return of
your own message call.
Recursion
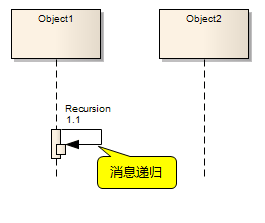
Internal communication manifests
itself as a recursive invocation of an operation,
or a method invoking other methods that belong to
the same object. Displays nested control focus for
execution events on the lifeline.
Call
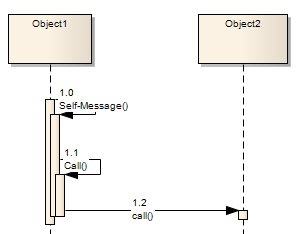
A call is a message connector
that extends the activation level of the previous
message. All self-information creates a new activation
level, but this control usually ends with the next
message (unless the activation level is manually adjusted).
Self-message calls, as shown in the image of the first
call, represent nested calls; A new activation level
is added with each call. Unlike regular messages between
elements, calls between elements continue existing
activations in the source element, meaning that the
call was initiated within the activation range of
the previous message.
Sequence Diagram Modeling Guide
Denote the Lifecycle of an Element
Capture the element lifecycle
with a message represented as a New or Delete message
type
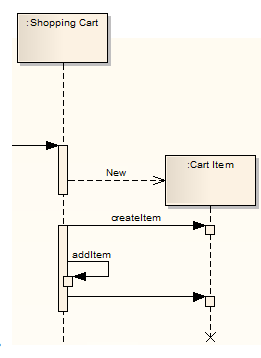
This example shows two elements
with specific creation and deletion times.
Layout of Sequence Diagrams
| Icon
|
Element name
|
Description
|
 |
Message
|
Messages indicate the
flow of information or control transitions between
elements.
|
 |
Self message
|
Self messages reflect
a new process or method that is invoked in an
action that invokes a lifeline
|
 |
Recursion
|
Recursion is a type
of message used in sequence graphs to indicate
a recursive function.
|
 |
Call
|
A call is a message
connector that extends the activation level of
the previous message.
|
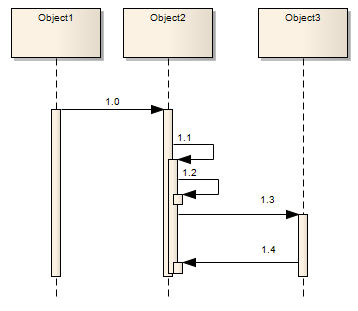
This example shows the layout
of a sequence diagram in use.
Sequence Element Activation
A sequence element in a sequence
diagram has a rectangle drawn along its lifeline.
These rectangles describe the amount of time an element
is active throughout the processing period. This visual
representation can be suppressed by right-clicking
on the sequence diagram and selecting "Suppress
Activations".
Usually, the EA calculates the
period of activation. There are several context menu
options on Sequence Message that you can use to accomplish
this task. To access the context menu, right-click
on the message and select Activations.
A branch with a previous message
After you set up your lifeline
and sequence messages with the appropriate message
grouping and activation levels, you may want to indicate
that the two messages emitted from the lifeline in
different message groups and at different activation
levels are branched, or executed at the same time.
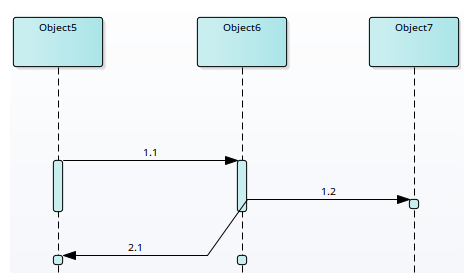
Consider this example:

Description: Message 1.1 is passed
from object 5 to object 6, then message 1.2 is passed
to object 7, and message 2.1 is passed back to object
5. The messages appear to be in the order of 1.1,
1.2, and 2.1. However, it would like to point out
that message 2.1, although separate, is concurrent
with message 1.2.
In this case:
Right-click on the message behind (2.1) and select
the option " Branch with previous message "
The source anchor for message
2.1 then changes to the same source as message 1.2,
which is the previous message. They are separate but
concurrent messages from the same lifeline.
If you don't need to show that
the message is a branch later, right-click on the
message behind it (2.1) and deselect the Branch with
previous message option.
Lifeline Activation Levels
By adding an activation layer
to a single lifeline, a complex processing system
can be easily reflected in a sequence diagram.
Example 1 :
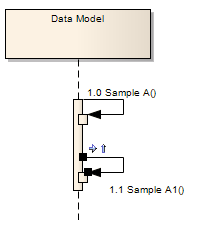
The class calls method Sample
A, which in turn calls Sample A1.
Here's how it works:
- Click in the Diagram Toolbox
 to display the Find Toolbox Item dialog box and
specify Interaction.
to display the Find Toolbox Item dialog box and
specify Interaction.
- Click the Interaction Relationships icon in the
Self-message panel.
- Click on Lifeline.
Example 2 :
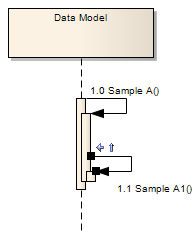
The lifeline now visually depicts
method Sample A1 that is called during processing
Sample A.
Example 3 :
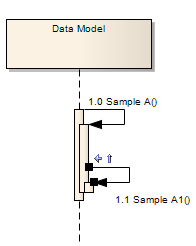
In this case, more self messages
have been added.
The message Sample A2a is called
from Sample A2, which in turn is called from Sample
A (instead of Sample A1).
Sample A1 is called from Sample
A.
Message Label Visibility
Hide and show the labels used
in the sequence message as follows:
1. Right-click on the message
in the sequence diagram and select Set Label Visibility.
2. The Label Visibility dialog
box is displayed.
3. Select or clear the check boxes
for each message label you want to show or hide, individually.
4. Click the OK button to save
the settings.
Change the Top Margin (create
usable space at the top of the diagram)
In order to change the top edge
of the sequence diagram from the default of 50 units,
right-click on the diagram and select the "Set
Top Margin" option. You can set the top blank
to any value between 30 and 250 units. You can then
use this space, for example, to add a Note or Text
element to provide a document on a diagram.
Change the Timing Details
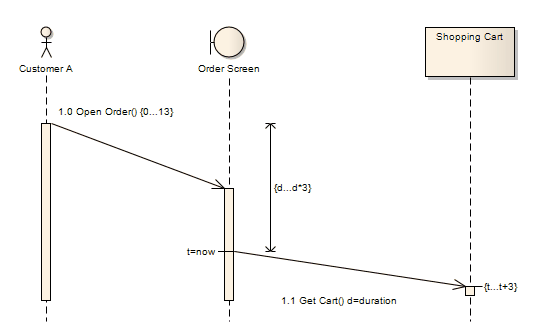
In this image, on the open order
message:
The Duration Constraint is set to 0...13
On the Get Cart message:
The Duration Constraint Between Messages has been
set to d... d*3
Duration Observation is set to d=duration
Time Constraint has been set to t... t+3
Time Watch is set to t=now
You can adjust the message angle
by typing a value in the Duration constraint field.
You can also create a Duration
Constraint Between Messages row by dragging the General
Ordering arrow up to the point where the previous
message joins the source lifeline of the current message.
A dialog box appears where you can enter constraint
values. Once you have created a line, you can move
it to any point in the middle of the current message
and the previous message to avoid overlapping with
other message timing details. The value can be edited
or deleted through the Timing Details dialog box or
by right-clicking on the row itself and selecting
the appropriate context menu option.
| Venue |
Let's go
|
| Duration constraints
|
Minimum and maximum
limits that indicate how long a message can last.
|
| Duration constraints
between messages
|
Indicates the minimum
and maximum interval between sending or receiving
the previous message and sending the current message
in the source lifeline of the current message.
|
| Duration observation
|
The duration
of the capture message
|
| Timing constraints
|
Indicates the shortest
and longest time the message should reach the
target.
|
| Timing observations
|
Capture the point at
which the message was sent.
|
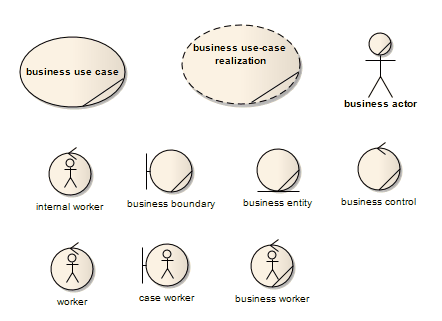
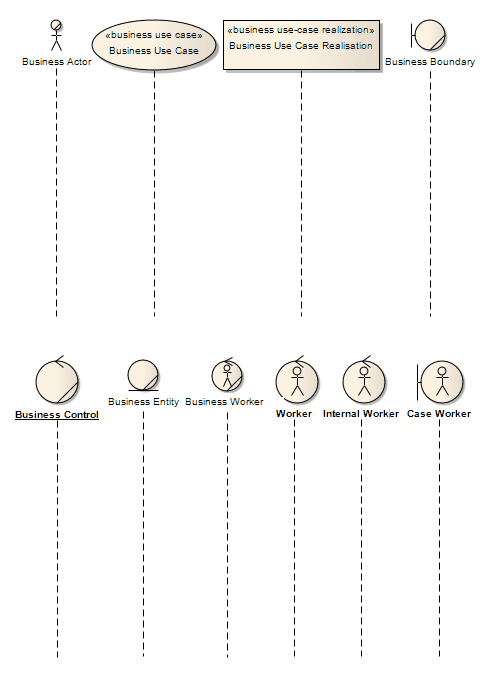
Business Modeling/Interaction
Business Modeling Diagrams and
Business Interaction Diagrams can model the structure
and behavior of business systems. A business modeling
diagram is based on a class (UML structure) diagram,
while a business interaction diagram is based on a
sequence (UML behavior) diagram. Both diagram types
have the same default Toolbox, which consists of pages
of Business Modeling elements. The available elements
include prototype objects, prototype actors (business
actors), use cases (business use cases), and collaboration
(business use case implementations).
The diagram shows what an element
looks like from the Business Modeling page of the
Diagram Toolbox that is dragged and dropped onto the
Business Modeling Diagram.
This diagram shows what an element
looks like when dragged and dropped onto a business
interaction diagram from the Business Modeling page
of the Diagram toolbox.
Sequence Diagrams and Version
Control
You can create sequence diagrams
that use elements from other packages as lifelines
in the diagram. In this case, the diagram can be corrupted
when the element package is checked in and out under
version control. This is because during the checkout
process, the elements are first removed from the model
and then re-imported, and although they are restored
in the diagram, there is no message connecting them.
Therefore, if the diagram and
its elements are in different packages, the round-trip
of the element package through version control can
corrupt the sequence diagram.
The solution is to drag and drop
each class as an object onto the sequence diagram
- when dragging and dropping the class onto the sequence
diagram, select the Instance as Element (Object) option
in the Paste Element dialog box. This creates a new
object in the chart's parent package based on the
selected Class element. Then, create messages between
the objects.
So, to make sure that the sequence
diagram isn't corrupted by other packages through
versioned round-trips, keep in mind that:
The lifeline must be an object (even though an
element can be dragged and dropped onto the sequence
diagram as a lifeline, it is not a strictly UML-compliant
construct)
The lifeline must be in the same package as the
chart
This diagram shows a browser window
with two packages: P1 which contains the elements
and P2 which contains a sequence diagram that uses
these elements. The chart itself is also shown.

This diagram does not break when
going round trip through version control because all
lifelines are objects, and those objects are in the
same package as the sequence diagram.
Sequence Diagram Options
When modeling with sequence diagrams,
there are a number of rendering features specific
to that diagram type, such as controlling the focus
of the indicator. In addition to the more general
chart settings defined on other chart pages of the
Preferences dialog box, you can define default settings
for these features.
If you
would like to learn more:
Welcome to the Modelers Channel
http://modeler.org.cn/
You are also welcome to contact
us directly at umlooo@hotmail.com
Postscript
I hope you have benefited from reading this.
If you are willing to share your experience, please submit it to us.
If you are interested in our training, consulting and tools:
|